
Friday, May 29, 2009
Saturday, May 23, 2009
Three Charts on Inflation
First Annual Inflation and Capacity Utilization:

Then Monetary Base and CPI 1982 to 2008

Finally the same from 1982 to 2009. What kind of impact will this hockey stick have on the price level?

Then Monetary Base and CPI 1982 to 2008
Finally the same from 1982 to 2009. What kind of impact will this hockey stick have on the price level?
Thursday, May 21, 2009
Recession Haiku
Via CrossingWallstreet a fun challenge, here is mine:
What grew GDP?
Too much leverage and some
Now it's over, save!
What grew GDP?
Too much leverage and some
Now it's over, save!
Deleveraging
Great little paper from the San Francisco Fed on consumer deleveraging.
Taking Japan as an example the process may take 10 years till 2018 to bring back household debt to personal income to 100%, the level of 2002, from the excessive 133% reached in 2007.
Their conclusion: "A simple model of household debt dynamics can be used to project the path of the saving rate that is needed to push the debt-to-income ratio down to 100% over the next 10 years—a Japan-style deleveraging. Assuming an effective nominal interest rate on existing household debt of 7%, a future nominal growth rate of disposable income of 5%, and that 80% of future saving is used for debt repayment, the household saving rate would need to rise from around 4% currently to 10% by the end of 2018. A rise in the saving rate of this magnitude would subtract about three-fourths of a percentage point from annual consumption growth each year, relative to a baseline scenario in which the saving rate did not change."
Wednesday, May 20, 2009
Book Review - The Snowball: Warren Buffett and the Business of Life
Thanks Brad de Long for highlighting this book review by Michael Lewis. Have read Lowenstein's Buffett: the Making of an American Capitalist and was not keen on reading an other 960 pages on the great investor so this six pages summary comes in handy. A conclusion from the richest man on earth: ""Basically, when you get to my age," she quotes him telling a group of business school students, "you'll really measure your success in life by how many of the people you want to have love you actually do love you. I know people who have a lot of money, and they get testimonial dinners and they get hospital wings named after them. But the truth is that nobody in the world loves them.""
Tuesday, May 19, 2009
Monday, May 18, 2009
Yield Curve Slope
As said I was intrigued by CrossingWallstreet comment that "Probably the most fascinating stat is that all of the stock market’s net capital gains have come when the 10-year yield is 65 or more basis points above the 90-day yield (that happens about 70% of the time). The yield curve hasn’t been that positive in 15 months. Anything less than 65 basis points, including a negative yield curve, works out to a net equity return of a Blutarsky. Zero Point Zero."
So I had a closer look at the data. First here is a look at monthly S&P500 performance according to yield curve slope deciles.
Since April 1953 whenever the yield curve is negatively sloping the average monthly S&P500 perf is negative as well. The best monthly performances occur when the yield curve is sloping between +1.3% and +2.11%.
Using CrossingWallstreet's idea I updated the following chart of cumulative S&P performance. Zero cumulative performance as long as the slope is smaller than 90bp. Will add this consideration in my timing decision going forward.

So I had a closer look at the data. First here is a look at monthly S&P500 performance according to yield curve slope deciles.
| Decile | Perf | |
| < | 0.01 | -0.3% |
| < | 0.38 | 0.4% |
| < | 0.64 | 0.4% |
| < | 1.00 | 0.1% |
| < | 1.30 | 0.9% |
| < | 1.59 | 2.1% |
| < | 2.11 | 1.0% |
| < | 2.56 | 0.4% |
| < | 2.95 | 0.6% |
| < | 4.42 | 0.6% |
Since April 1953 whenever the yield curve is negatively sloping the average monthly S&P500 perf is negative as well. The best monthly performances occur when the yield curve is sloping between +1.3% and +2.11%.
Using CrossingWallstreet's idea I updated the following chart of cumulative S&P performance. Zero cumulative performance as long as the slope is smaller than 90bp. Will add this consideration in my timing decision going forward.

Market Psychology Explained
Funny read from Paul Krugman written in the late 90's as the S&P500 was ca 20% higher: "But suppose that, for whatever reason, the market goes up month after month; your MBA-honed intellect may say "Gosh, those P/Es look pretty unreasonable", but your prehistoric programming is shrieking "Me want mammoth meat!" - and those instincts are hard to deny."
Sunday, May 17, 2009
Total on Peak Oil
H/T Paul Kedrosky for highlighting this article on Total. The article explains the implications of Total's belief that global oil production will peak at 95m barrels per day roughly a decade from now. Tar sands, Solar, Nuclear, Venezuela hence all on the company's prio list.
Thursday, May 14, 2009
A Sci Fi Writer on the Near Future
H/T Brad de Long for the reference. Just a few years down the road: "Storage is basically so cheap it's nearly free. Why not record a constant compressed video stream of everything you look at with those glasses? Tag it by location and vocalization — do speech-to-text on your conversation — and by proximity to other people. Let your smartphone remember things and jog your memory: you'll be able to query it with things like, "who was that person sitting at the other side of the table from me in the Pike Brewery last Tuesday evening with the fancy jacket I commented on?" Or maybe "what did Professor Jones say fifteen minutes into their Data Structures lecture on Friday while I was asleep?"".
Yield Curve
CrossingWallstreet on the yield curve as the best forecaster out there. I will still check his statement that: "Probably the most fascinating stat is that all of the stock market’s net capital gains have come when the 10-year yield is 65 or more basis points above the 90-day yield (that happens about 70% of the time). The yield curve hasn’t been that positive in 15 months.
Anything less than 65 basis points, including a negative yield curve, works out to a net equity return of a Blutarsky. Zero Point Zero."
Wednesday, May 13, 2009
Green Shoots?
Great charts from CalculatedRisk first on retail sales flattish MoM in April after the nice jump in Q1 from the dismal December level:

An then on the inventory to sales ratio. In spite of the large reported drop in inventories in Q1 the inventory to sales ratio remain very elevated indicating further reductions may still be on the way:

Expect a slow and long recovery.
An then on the inventory to sales ratio. In spite of the large reported drop in inventories in Q1 the inventory to sales ratio remain very elevated indicating further reductions may still be on the way:
Expect a slow and long recovery.
Sunday, May 10, 2009
Inflation and Quantitative Easing
Econbrowser starts to worry about inflation. He posts the following chart of various commodity prices since the Fed announced its QE stance on March 18 and concludes: "But this is a trend the Fed needs to watch closely from here, and could prove to be a significant limiting factor on how much the Fed can hope to achieve from monetary stimulus. Because I for one do not think it's a good idea to call for a replay of the 2008:H1 commodity market show"

Interesting how Gold did not move compared to industrial metals.
Interesting how Gold did not move compared to industrial metals.
Saturday, May 9, 2009
Stress Test
The results from the stress test of the banks are out. You can read them here (see page 10). Back in March I had looked at whom the market was judging likely to pass the test using the simple criteria of ytd performance of the stocks underlying the test. The market got 12 results correctly. Not bad but still within one standard deviation of the mean of a binomial distribution.
Monday, May 4, 2009
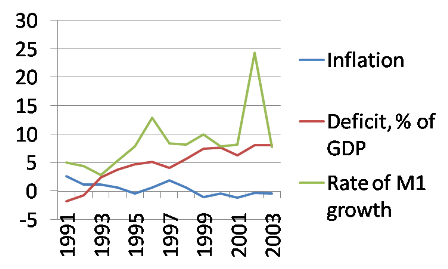
"A History Lesson" from Paul Krugman
For those who fear inflation Prof Paul Krugman has the following history lesson on Japan's lost decade. In spite of large deficit and strong monetary expansion no sign of inflation and no currency devaluation either. Will the same happen to the US though?
Saturday, May 2, 2009
Current Recession Vs Depression
CalculatedRisk has an interesting post on Depression Scares quoting prof. Robert Shiller. He notes the cumulative US GDP decline form peak is 3.3% so far vs down 10% for a depression. He adds further: "Even though the current recession is already one of the worst since 1947, it is only about 1/3 of the way to a depression (commonly defined as a 10% decline in real GDP). Stated another way, to reach a depression, the economy would have to decline at about the same annual rate as the last two quarters for the next four quarters."

Global Recessions
From the Economist:

Global output per head registered negative growth on four occasions in the past 50 years. The current drop truly looks nasty. Interestingly the forecast drop in oil consumption is close to the average of 75, 82 and 91. Is this too optimisitic or has the world become so much more energy efficient?
Global output per head registered negative growth on four occasions in the past 50 years. The current drop truly looks nasty. Interestingly the forecast drop in oil consumption is close to the average of 75, 82 and 91. Is this too optimisitic or has the world become so much more energy efficient?
Friday, May 1, 2009
A New Bull Market?
ZeroHedge does not think so making his case looking at the table below which compares the current situation to the metrics as they were at the start of the 82 bull market.
You had then less credit and leverage, higher interest rates and inflation, lower PE, higher dividends, mores savings, less equities in the portfolios, all conditions that could set the stage for a credit fuelled economic expansion with an expansion of valuation multiples.

You had then less credit and leverage, higher interest rates and inflation, lower PE, higher dividends, mores savings, less equities in the portfolios, all conditions that could set the stage for a credit fuelled economic expansion with an expansion of valuation multiples.
Subscribe to:
Comments (Atom)

