Showing posts with label Valuation. Show all posts

Tuesday, February 19, 2013

Bull Market Ahead?

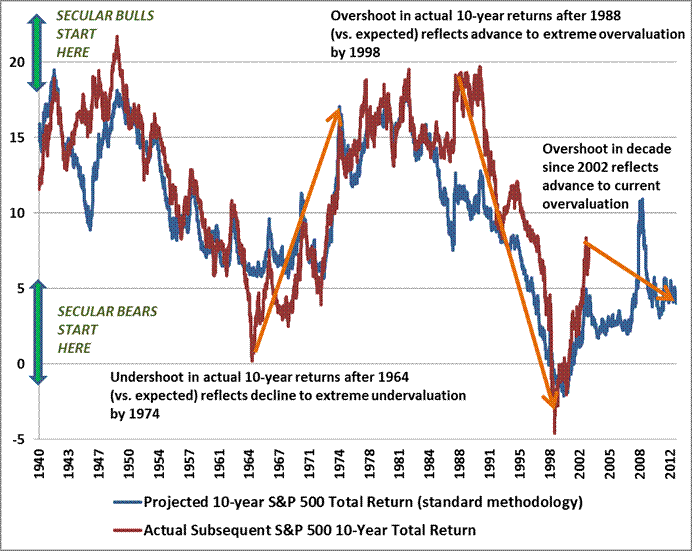
After the run we've witnessed in equity markets since March 2009 Dr. Hussman provides a verty interesting market commentary where he explains: "Simply put, secular bull markets begin at valuations that are associated with subsequent 10-year market returns near 20% annually. By contrast, secular bear markets begin at valuations like we observe at present."
Visually based on the simple formula Shorthand 10-year total return estimate = 1.06 * (15/ShillerPE)^(1/10) – 1 + dividend yield(decimal).
 
Hussman explains further "Presently, the Shiller P/E is 22.7, with a dividend yield of 2.2%. Do the math. A plausible, and historically reliable estimate of 10-year nominal total returns here works out to only 1.06*(15/22.7)^(.10)-1+.022 = 3.9% annually".

Monday, August 23, 2010

Market Update

Econbrowser has a great analysis of where we stand market valuation wise. Using Prof Shiller's data he posts the following charts:
(1) 17% downside to be back to average

(2) A chart comparing PE and the following 10 year nominal returns of the S&P500. At the current PE do not expect much in the next years if history is any guide


(3) And among others a chart comparing the dividend yields vs tips' and bond yields.
While equities do not strike as bargains they still compare favourably to bonds.


He concludes: "A buyer of stocks today is usually getting a higher immediate yield than on TIPS, in addition to prospects of future dividend growth. Just as they did in the 19th century, stocks as priced today should give you a significantly better return than bonds"

Tuesday, October 6, 2009

S&P500 Fair Value

Eddy Elfenbein at CrossingWallstreet sums it up:

"For 2009, the S&P 500 will make around $55 to $60 a share. For 2010, earnings will probably be around $75 a share. For 2011, and now it’s starting to become hard to forecast, Wall Street sees earnings at $92 a share.

If that’s correct, then the stock market is still pretty inexpensive. At 15 times earnings, $92 a share translates to 1380 for the index by the end of 2011. If we discount that by 8% to today (I get 8% by adding a 3% premium to 5% which is about where AAA corporates are), we get 1160."

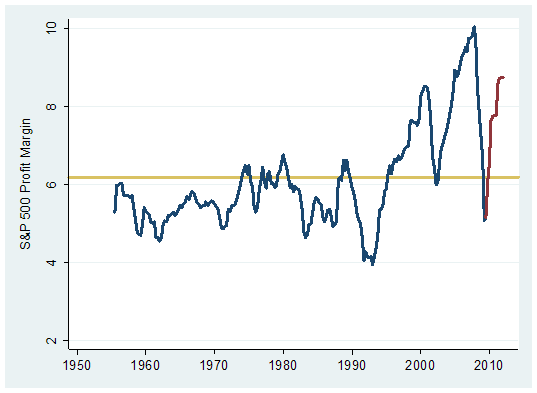
At Hussman Funds Bill Hester appears less optimistic arguing that analysts now expect margins to recover to peak level, an unlikely scenario in a lower growth environment.

Wednesday, March 25, 2009

Stocks vs Bonds

Brad De Long comments on Authers from the FT, adds this great chart:
and posts "Of course, going forward the current value of the Graham Ratio--of stock prices to the ten-year lagged moving average of real earnings--predicts that stocks will beat ten-year Treasuries by an average of 7.5% per year over the next decade..."

Friday, March 13, 2009

Tobin's Q

The Fed recently released it latest quarterly flow of funds data. The data can be used to calculate Tobin's Q measure of market valuation.
See Wikipedia here
See some source data here and a recent comment from Felix Salmon. Naked Capitalism is skeptical as to the use of the ratio to call market bottom. I concur but I'll revert with a post on trading strategies using valuation as a guide.
In the meantime here is a chart combining the source data mentionned above as well as the latest flow of funds data (Table b102, row 35 / row 32)

Monday, March 2, 2009

Calling a bottom?

CrossingWallstreet explains why "Trying to pick the bottom, however, is a dangerous undertaking and is, in his opinion, best left alone".

With the market making new lows Prof James Hamilton has an excellent post on stock prices and fundamentals trying to answer the question: "How low can stock prices go, and how worried should you be?"

He uses a Dividend Discount Model under two scenarios (1) real dividend grow 2% from the last reported value (2) dividends first follow the same path as during the great depression and then grow again.

Figure 4.Black line: actual stock price. Blue line: perfect-foresight price P*(t) under scenario 1. Green line: perfect-foresight price under scenario 2 (Great Depression II with dividends taking the same path as between 1931 and 1936)
According to Prof Hamilton at 608 the S&P500 would price in the same dividend trajectory as during the great depression and 5.5% real annual returns forever.

At a level of 735 and assuming the market drops to 608 before recovering the market is pricing in 3.6% real return over 10 years. Not bad.

His conclusion: "Of course, under this scenario you would do better waiting for the market to recognize the depression and wait to buy at 608 rather than now at 735. Moreover, given the historical tendency for over exuberance in upswings and excessive pessimism in downturns, you might expect the actual price to fall well below 600 in another depression, at which point there will be returns to be had well in excess of 5.5% if you time your moves just so.

But good luck with carrying out that particular scheme. After all, scenario 2 assumed we're about to start another Great Depression, and hopefully it goes without saying that this need not necessarily happen. If it doesn't, you may find yourself waiting for the S&P to fall below 600 until you're both retired and dead. If the downside to investing now, even under the depression scenario, is better than a 3% average real rate of return over the next decade, I can live with that."

Note: here is a link to an older post on investments.

We're getting there.
Monday, February 23, 2009

Valuation Update

First: Prof Robert Shiller from Yale actually provides online the data he uses for his long term PE chart. You can access it here. His PE chart is "real", ie both S&P levels and earnings are adjusted for inflation. Very useful, no need to play around with S&P data anymore!

The dataset also contains info on dividends and interest rates that got me started on a simple Dividend Discount Model. Here is a first chart on the implied cost of capital assuming growth of 5.5% (3% real and 2.5% inflation). On this metric the market does not seem that cheap at least compared to the 82 low.


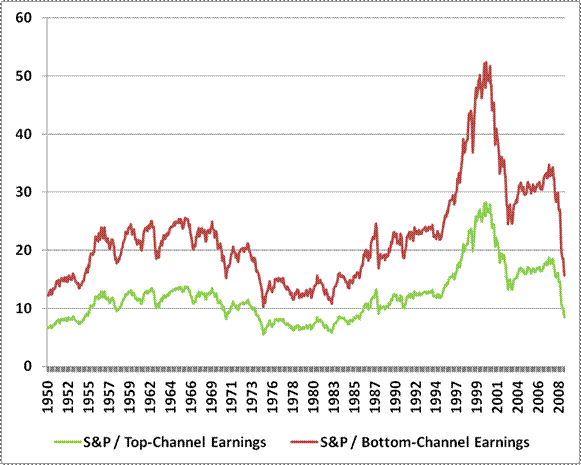
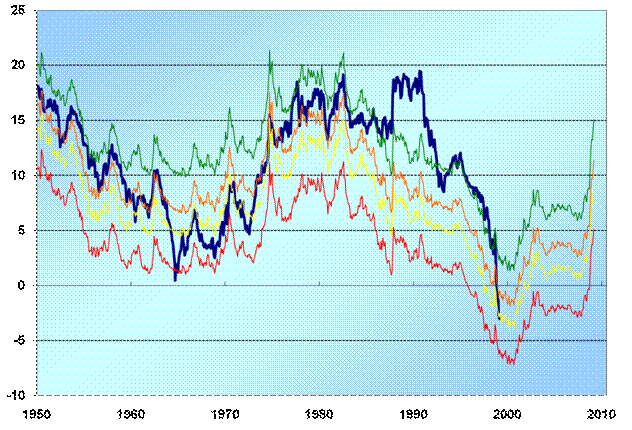
Second: John Hussman from Hussmanfunds has an excellent market comment where he proposes "Property Appreciation Rights" as part of the solution to the current mortgage problems. He also discusses these great long term valuation charts:

(1) Earnings Growth Channel:


(2) PE based on Earnings Channels


(3) 10 year total return projections


Sunday, February 15, 2009

Earnings and valuation

The drop in earnings animates the discussions. See Barry Ritholz first with a very provocative target for the S&P500 and the response by Peridot Capitalist.
I created below a long term chart based on 10 year rolling earnings for the S&P500. The chart shows the PE, the average and a one standard deviation band. To discuss the findings further I added as well the YoY change in CPI.


Key findings:
(1) The 48 year average is roughly 22x 10 year rolling earnings.
(2) The current level of 15x is ca one standard deviation below the average. The last time it was so low was in the 70's.
(3) Indeed in the 70's this metrics was lower fluctuating between 15 and 10x. Note though that during that period inflation was much higher than currently.
(4) The market bottomed in 82 at 10x 10 year rolling earnings
(5) The Internet bubble is clearly visible. Interestingly the recent bull run from 2002 to 2007 happened at a valuation ca one standard deviation above the long term average.
(6) Interpretations of the apparently low level of valuation based on 10 year rolling earnings?
(a) Past 10 year earnings were inflated
(b) Future earnings will remain lower for longer
(c) The market is cheap