First: Prof Robert Shiller from Yale actually provides online the data he uses for his long term PE chart. You can access it here. His PE chart is "real", ie both S&P levels and earnings are adjusted for inflation. Very useful, no need to play around with S&P data anymore!


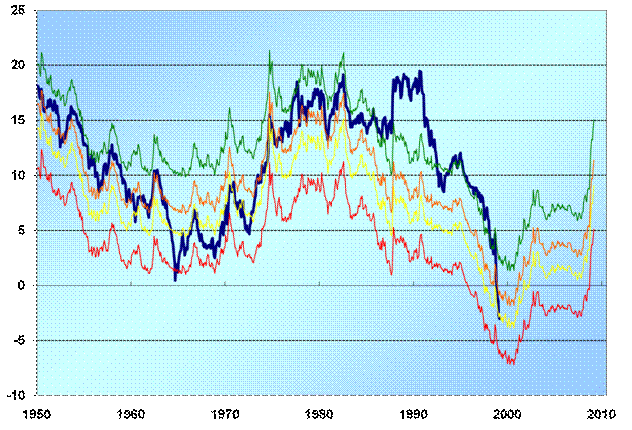
The dataset also contains info on dividends and interest rates that got me started on a simple Dividend Discount Model. Here is a first chart on the implied cost of capital assuming growth of 5.5% (3% real and 2.5% inflation). On this metric the market does not seem that cheap at least compared to the 82 low.

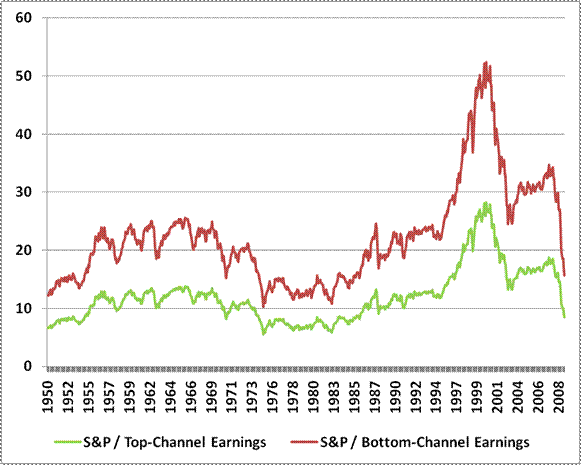
Second: John Hussman from Hussmanfunds has an excellent market comment where he proposes "Property Appreciation Rights" as part of the solution to the current mortgage problems. He also discusses these great long term valuation charts:
(1) Earnings Growth Channel:

(3) 10 year total return projections


No comments:
Post a Comment