Came across this interesting collection of papers on golf statistics.
The Wharton paper on Loss Aversion is very interesting. Golf pros put better for par than for birdie. A bias that cost the best players 1.2m in prize money a year.
Pros also make 99.2% of the puts of 3 feet or less, pros make less than 50% of puts longer than 8 feet.
Thursday, August 18, 2011
Wednesday, July 27, 2011
Thursday, June 9, 2011
Oil Demand exceeds production
Don't blame speculators for the high oil price. Here is a chart from the economist showing how oil consumption now exceeds production.

Wednesday, March 9, 2011
Oil Copper Spread
Prof Krugman highlights the following chart: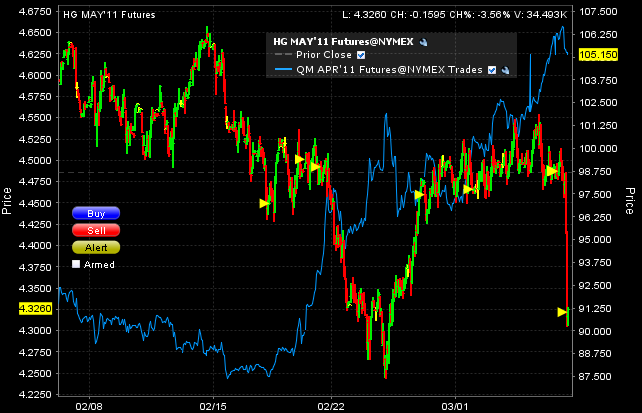
Copper is mainly driven by economic factors while oil both by eco and geopolitical risks and both commodities now seem to tell a different story.
Copper is mainly driven by economic factors while oil both by eco and geopolitical risks and both commodities now seem to tell a different story.
The Importance of Saudi Arabia
Ecnobrowser has an other excellent post showing how SA had been able to increase oil production in time of high shortfall elsewhere (Iraq War 1, Venezuelan strike in 02, Iraq war 2).
With the oil price at 106 "only" he doubts they will produce much more than in July 08 when the price was at 147.
With the oil price at 106 "only" he doubts they will produce much more than in July 08 when the price was at 147.
Friday, February 11, 2011
China's growth compared
Great chart highlighted by Paul Kedrosky. China just slightly outgrowing other countries at similar stage of developments though not by much. GS expects a path similar to Taiwan's.

Thursday, February 10, 2011
Economic Data
Calculated Risk has an other extremely useful post summarizing and ranking economic data.
The list is here and he asks: "Another FAQ: Why does CR give everything away for free? Because ." Much appreciated.
The list is here and he asks: "Another FAQ: Why does CR give everything away for free? Because ." Much appreciated.
Wednesday, February 9, 2011
Economics Best Of
Prof Krugman mentions the economist's best of, the top 20 articles of the AER's first 100 years.
Key takeaways and articles
Key takeaways and articles
Monday, February 7, 2011
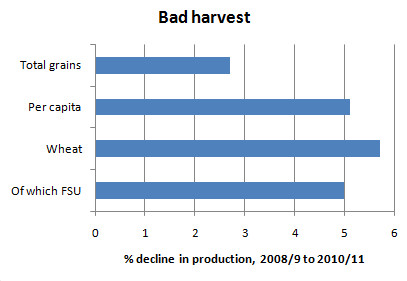
Here we go again - Soaring Food Prices
Prof Krugman attributes the recent surge in food price to the declining supply following weak harvests in Russia. Global per capita grain production is down 5% in the past 2 years while demand is growing. With low demand elasticity large prices rises are necessary to curb consumption.
Monday, January 17, 2011
Historical Oil Shocks
With Oil above 90 USD here is a timely paper from prof Hamilton. Added to the reading pile. The prof has a summary here.
He fears we may soon have to add a line to the following table.
He fears we may soon have to add a line to the following table.
| Gasoline shortages | Price increase | Price controls | Key factors | Business cycle peak |
|---|---|---|---|---|
| Nov 47-Dec 47 | Nov 47-Jan 48 (37%) | no (threatened) | strong demand, supply constraints | Nov 48 |
| May 52 | Jun 53 (10%) | yes | strike, controls lifted | Jul 53 |
| Nov 56-Dec 56 (Europe) | Jan 57-Feb 57 (9%) | yes (Europe) | Suez Crisis | Aug 57 |
| none | none | no | --- | Apr 60 |
| none | Feb 69 (7%) Nov 70 (8%) | no | strike, strong demand, supply constraints | Dec 69 |
| Jun 73 Dec 73-Mar 74 | Apr 73-Sep 73 (16%) Nov 73-Feb 74 (51%) | yes | strong demand, supply constraints, OAPEC embargo | Nov 73 |
| May 79-Jul 79 | May 79-Jan 80 (57%) | yes | Iranian revolution | Jan 80 |
| none | Nov 80-Feb 81 (45%) | yes | Iran-Iraq War, controls lifted | Jul 81 |
| none | Aug 90-Oct 90 (93%) | no | Gulf War I | Jul 90 |
| none | Dec 99-Nov 00 (38%) | no | strong demand | Mar 01 |
| none | Nov 02-Mar 03 (28%) | no | Venezuela unrest, Gulf War II | none |
| none | Feb 07-Jun 08 (145%) | no | strong demand, stagnant supply | Dec 07 |
Tuesday, January 11, 2011
Outlook 2011
It s the time for this again. Bloomberg lists the strategists forecasts for 2011.
So roughly 8.5% upisde from current level.
Last year's forecasts were pretty much spot on. With Median 2012e EPS currently at 102 it is not unreasonable to expect a new record for the S&P within the next 12-18 months. Time will tell.
Firm                 Strategist           2011 Close   2011 EPS
===============================================================
Bank of America      David Bianco           1,400       $93.00
Bank of Montreal*    Ben Joyce              1,350       $90.00
Barclays             Barry Knapp            1,420       $91.00
Citigroup**          Tobias Levkovich       1,400       $96.50
Credit Suisse        Douglas Cliggott       1,250       $91.00
Deutsche Bank        Binky Chadha           1,550       $96.00
Goldman Sachs        David Kostin           1,500       $96.00
HSBC                 Garry Evans            1,430
JPMorgan             Thomas Lee             1,425       $94.00
Morgan Stanley       Adam Parker            1,238       $93.00
Oppenheimer          Brian Belski           1,325       $88.50
RBC                  Myles Zyblock                      $88.00
UBS                  Jonathan Golub         1,325       $96.00
---------------------------------------------------------------
Mean                                        1,384       $92.75
Median                                      1,400       $93.00
High                                        1,550       $96.50
Low                                         1,238       $88.00

  * BMO’s forecast is a rolling 12-month projection.
  ** Citigroup’s estimate for S&P 500 profit is from Steven
So roughly 8.5% upisde from current level.
Last year's forecasts were pretty much spot on. With Median 2012e EPS currently at 102 it is not unreasonable to expect a new record for the S&P within the next 12-18 months. Time will tell.
Subscribe to:
Posts (Atom)

