Showing posts with label Growth. Show all posts

Sunday, September 1, 2013

An Emerging Market Crisis?

At first Prof Krugman had a rather reassuring view on the INR weakness even concluding "So at first examination this doesn’t look like as big a deal as some headlines are suggesting". He also had a good explanation for the current weakness of em assets: "We more or less know the story here. First, advanced countries plunged into a prolonged slump, leading to very low interest rates; capital flooded into emerging markets, causing currency appreciation (or, in the case of China, real appreciation via inflation). Then markets began to realize that they had overshot, and hints of recovery in advanced countries led to a rise in long-term rates, and down we went."

But here is a list of op-eds that are much less optimistic and that suggest further adjustments may be in the cards.

Back in July Trouble in emerging market paradise by Nouriel Roubini who concluded "These factors explain why growth in most BRICS and many other emerging markets has slowed sharply. Some factors are cyclical, but others – state capitalism, the risk of a hard landing in China, the end of the commodity super-cycle – are more structural. Thus, many emerging markets’ growth rates in the next decade may be lower than in the last – as may the outsize returns that investors realized from these economies’ financial assets (currencies, equities, bonds, and commodities).
Of course, some of the better-managed emerging-market economies will continue to experience rapid growth and asset outperformance. But many of the BRICS, along with some other emerging economies, may hit a thick wall, with growth and financial markets taking a serious beating."

A bumpy ride for emerging markets from Laura Tyson with a key message "when the Fed tightens monetary policy to manage macroeconomic conditions in the US, there are large unintended spillover effects on capital flows to emerging markets". Though EM are nowadays better equipped to weather the storm than in the past she mentions "some countries are at risk, especially those with large current-account deficits, large foreign capital inflows relative to the size of their financial markets, and low foreign-exchange reserves. Among the most vulnerable are Turkey, South Africa, Brazil, India, and Indonesia – a group that Morgan Stanley researchers have dubbed the “Fragile Five.""

The end of the emerging market party from Ricardo Hausmann who concludes "The same dynamics that inflated the dollar value of GDP growth in the good years for these countries will now work in the opposite direction: stable or lower export prices will reduce real growth and cause their currencies to stop appreciating or even weaken in real terms. No wonder the party is over."

Danny Leipziger on Brazil's growth imperative which states: "Brazil has lost its swagger. Growth estimates for this year put Latin America’s largest economy above only Venezuela and El Salvador in the region, and the outlook for next year is not much better. Brazil’s currency, the real, has fallen to its lowest level against the US dollar in more than four years, compelling the government to pump billions of dollars into the foreign-exchange futures market and raise interest rates to deter capital outflows – just a few years after imposing a new tax to deter inflows."

Abenomics for Asia by Yuriko Koike who concludes: "Sixteen years ago, the Asian financial crisis erupted, following the Thai government’s decision to float the baht in the face of speculative attacks. The response of governments to that crisis has shaped much of the region’s economic policymaking ever since. If Asia is to avoid another crisis on a similar scale, or lost decades of growth, its governments will need to embrace the type of all-encompassing reforms that Japan is undertaking. Abenomics, it seems, is for everyone."

The Global QE Exit crisis by Stephen S. Roach who concludes: "Where this stops, nobody knows. That was the case in Asia in the late 1990’s, as well as in the US in 2009. But, with more than a dozen major crises hitting the world economy since the early 1980’s, there is no mistaking the message: imbalances are not sustainable, regardless of how hard central banks try to duck the consequences. Developing economies are now feeling the full force of the Fed’s moment of reckoning. They are guilty of failing to face up to their own rebalancing during the heady days of the QE sugar high."

And finally Brad DeLong commenting on Mrs Tyson's piece above sums it up nicely: "The fear is, as Rudy Dornbush used to put it, that India and other emerging markets are right now not North Atlantic but rather South American economies".

A case of multiple equilibria? One day half full and filling up and the next half empty and leaking fast.


Friday, February 11, 2011

China's growth compared

Great chart highlighted by Paul Kedrosky. China just slightly outgrowing other countries at similar stage of developments though not by much. GS expects a path similar to Taiwan's.

Monday, December 6, 2010

Tuesday, September 14, 2010

An Interesting Question

Prof De Long plays with some numbers and asks a very interesting question:
"Thus the key question in understanding the economies of long-long ago. Were they people with
motivations like us living in economies that worked more-or-less as ours does, and was the glacial pace of growth and the Malthusian structure the result of the disabilities they labored under? Or was there something very different—and from our perspective very wrong—with the stuff of the economic mechanism itself?"
http://www.j-bradford-delong.net/2008_pdf/20080120_longestrungrowth.pdf

Tuesday, May 18, 2010

Optimists

Equity analysts have been too optimistic. McKinsey ran the numbers and in the past analysts have substantially overestimated earnings growth. Earnings have grown at ca 6% annually vs over 12% for the analysts' guess.
Get that 6% not more!
6% seems a lot like long term nominal GDP growth. According to BEA stat US Nominal GDP grew at 6.3% annually from 1929 to 2009 and at 5.3% annually over the past 25 years. No magic here over long period of times earnings just can't outgrow the economy.

Wednesday, September 23, 2009

Sometimes I wish I was a student again...

... taking Brad de Long's exam:

No calculators allowed, You won’t need them. All you will need is simple arithmetic (the ability to multiply things by two, and to divide) and the rule of 72—the fact that a quantity growing at 1% per year doubles in 72 years, a quantity growing at 2% per year doubles in 36 years, a quantity growing at 0.5% per year doubles in 144 years, et cetera, a quantity growing at 1% per year grows by 41.41% in 36 years, etc…

PART 3 (25 MINUTES): Calculations

Consider the 144 years between 1866 and 2010…

  1. World population grew from about 1.1 billion to 6.4 billion. About how many doublings did population undergo? What is the average growth rate of world population over those 144 years?
  2. World total real GDP (on one somewhat arbitrary set of assumptions, at least) grew from $875 billion of today’s dollars in 1866 to $56 trillion of today’s dollars today. What was the average growth rate of world total real GDP over those 144 years?
  3. If world total real GDP growth continues to grow at its average 1866-2010 rate, what will world total real GDP (in today’s dollars) be in 2155? Do you think this is possible? Reasonable? Absurd? Why?
  4. By contrast, total world GDP (on one somewhat arbitrary set of assumptions, at least) grew from $437.5 billion of today’s dollars in 1794 to $875 billion of today’s dollars in 1866. Suppose total world real GDP growth had continued at its 1794-1866 pace from 1866-2010. What would total world real GDP be today?

If I follow correctly. 2. implies 6 doublings in 144 years or an annual growth rate of 3%.
4. implies a growth rate of 1% (1 doubling in 72 years) continuing at that pace for an other 144 years the economy would have experienced two doublings to 3.5 trillion, not even 10% of today's size. Amazing!

Monday, September 21, 2009

"The Anarchy of Success"

Two book reviews in one by William Easterly at Aidwatch. The blog summary is here but the long piece is well worth reading.
In development economics beware of
Pattern in the clouds ("Humans are suckers for finding patterns where none really exist, like seeing the shapes of lions and giraffes in the clouds.")
Confirmation Bias ("When the evidence is mixed, we tend to select the parts of the evidence that confirm what we already believe")
Law of Small Numbers ("our tendency to judge performance by too small a slice of experience")

Key conclusions from Easterly:
"One way to escape from the Law of Small Numbers is to seek to explain levels of per capita income already attained today rather than rates of growth. The level of income you have reached today frees you from small numbers because it reflects the outcome of your entire previous growth experience. So let's ask, who are the richest and the poorest countries now, and what is the difference between them? I argued above that the now-rich countries leaped ahead during a long period in which they were more free-trade and free-market (although far from laissez-faire) than the rest of the world. Economists therefore have a much higher degree of consensus on this question—both evidence and intuition suggest that such things as education, private property, contract enforcement, and freedom from government expropriation contribute to economic development.
These findings just confirm the Western consensus around the basic concept of a state shaped by representative democracy, safeguarding individual rights and supplying crucial infrastructure such as transport, while rewarding entrepreneurship and technological creativity. Such common-sense ideas have stood the test of time over the very long run, both in their acceptance by the population in most economically successful societies (compared to their absence and rejection in unsuccessful economies) and in their pragmatic consequences for prosperity (as showed by the comparison to the poverty of states that lack most of the above conditions). Development is too complex to fit these ideas 100 percent of the time, of course—there are authoritarian exceptions like Singapore. China is not yet an exception because its income level is still less than one tenth that of the US. We can conjecture that China's rapid change in income has followed positive changes in individual economic (and even some political) rights."

"Perhaps prosperity is not after all designed from above; perhaps it emerges from below, from the independent actions of many individuals who figure out their own paths."

In the end, Korea didn't need experts like Ha-Joon Chang as much it needed entrepreneurs like Ju-Yung Chung. Chung was the son of North Korean peasant farmers, who had to leave school at fourteen to support his family. He had failed at successive jobs as a railway construction laborer, a dockhand, a bookkeeper, and a deliveryman for a rice shop in Seoul. At age twenty-two, he took over the rice shop, but it failed. He started A-Do Service Garage to do auto repair, which also failed. At age thirty-one in 1946 in Seoul, Chung again started an auto service, which finally became his first successful business. That auto service grew and diversified over the years. It is now known as Hyundai."

Thursday, September 17, 2009

V-Shape or Double Dip?

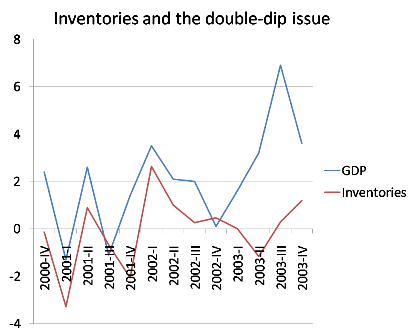
Paul Krugman illustrates very well why the risks of a double dip are real.
"There’s a tendency to treat worries about a double dip as outlandish, as something only crazy people like the people who, um, predicted the current crisis worry about. But there are some real reasons for concern. One is that the lift from fiscal stimulus will start to fade out in a couple of quarters. Another is that, as Yellen points out, most of the boost we’re getting now is tied to inventories. And that’s a one-time thing. You don’t have to look back very far to see just how transitory an inventory-led boost can be. The figure below shows growth before, during, and after the 2001 recession, together with the contribution of inventory changes to growth. Notice the boost from 2001IV to 2002I from inventories, then the fading out that almost, but not quite, turned into contraction later in 2002. It wasn’t literally a double-dip, W-shaped recession, but it came close.

Econbrowser more optimistically points towards Deutsche Bank's "credit impulse" indicator indicating a V-shape recovery. "Deleveraging implies slow growth in total credit, and according to the usual reasoning, slow growth in GDP. Several of Deutsche Bank's economists, however, focus on what they call the credit impulse. They provide the following provocative graph, which suggests a rapid recovery:"


Tuesday, September 1, 2009

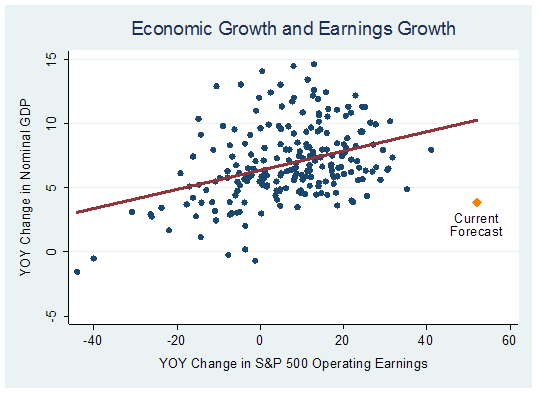
Nominal GDP and Earnings Growth

William Hester at Hussmanfunds has an interesting piece on nominal gdp and earnings growth. See chart below with the outlying current forecasts. In spite of the modest expected recovery operating earnigns are supposed to rebound strongly.
How important is the low base?
Is the relationship that strong once we remove the outliers in the bottom left corner?
Which variable is more likely to surprise? Eco on the upside or earnings on the downside?


Sunday, August 16, 2009

V-Shape

Here is a chart of YoY change in real GDP.
Since WW2 past episodes of ca -2.5% YoY change in real GDP have all been followed by a strong rebound, hence the usual V-Shape. Double dips are expceptional and muted rebounds inexistent.

Saturday, April 25, 2009

China: Electricity Consumption and GDP growth

Floyd Norris posts the China's year-over-year increases in its gross domestic product and electricity consumption for the first quarter of each year.

2002: Electricity up 9.4%, G.D.P. up 8%
2003: Electricity up 14.7%, G.D.P. up 10.3%
2004: Electricity up 16.7%, G.D.P. up 9.8%
2005: Electricity up 14.3%, G.D.P. up 9.9%
2006: Electricity up 13.4%, G.D.P. up 10.4%
2007: Electricity up 12.4%, G.D.P. up 11.7%
2008: Electricity up 16%, G.D.P. up 10.6%

China Q1'09 GDP was up 6.1% YoY while in the first two months of the year electricity consumption was down over 9% from last year.

This reminds me of this story of provinces overstating their GDP estimates.

Saturday, January 31, 2009

Long term growth

Here is an interesting chart on the long term growth in real per capita GDP, real stock price returns and real earnings taken from an article by Brad Cornell and Rob Arnott published in CFA Institute Magazine in Nov/Dec 2008. The authors mention that over the past 25, 50 and 100 years, annual real per capita GDP growth averaged 1.4%, 1.7% and 1.9% respectively.
Over the same periods real per share earnings grew 3.2%, 2.0% and 1.5% annually while the S&P500 increased by 5.1%, 2.7% and 1.9% per year above inflation. Very interesting to see how over the longest period (100 years) these measures grew at very similar paces.


Brad DeLong has an excellent little paper on economic growth here. It shows that the numbers above are just so much larger than before the industrial revolution.