Showing posts with label Earnings. Show all posts

Tuesday, May 18, 2010

Optimists

Equity analysts have been too optimistic. McKinsey ran the numbers and in the past analysts have substantially overestimated earnings growth. Earnings have grown at ca 6% annually vs over 12% for the analysts' guess.
Get that 6% not more!
6% seems a lot like long term nominal GDP growth. According to BEA stat US Nominal GDP grew at 6.3% annually from 1929 to 2009 and at 5.3% annually over the past 25 years. No magic here over long period of times earnings just can't outgrow the economy.

Tuesday, September 1, 2009

Nominal GDP and Earnings Growth

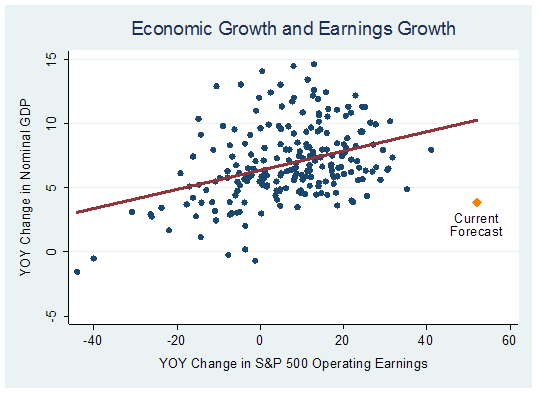
William Hester at Hussmanfunds has an interesting piece on nominal gdp and earnings growth. See chart below with the outlying current forecasts. In spite of the modest expected recovery operating earnigns are supposed to rebound strongly.
How important is the low base?
Is the relationship that strong once we remove the outliers in the bottom left corner?
Which variable is more likely to surprise? Eco on the upside or earnings on the downside?


Sunday, May 17, 2009

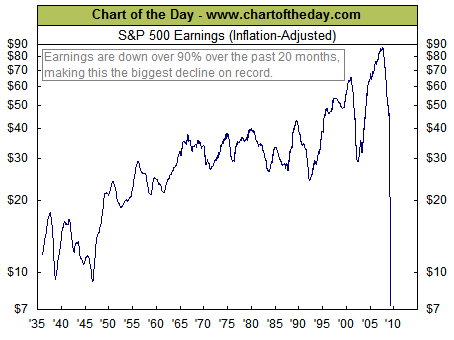
Earnings - the Only Way is Up?

Via the Big Picture:

and the S&P500, looking ahead, is still at 900!

Sunday, February 15, 2009

Earnings and valuation

The drop in earnings animates the discussions. See Barry Ritholz first with a very provocative target for the S&P500 and the response by Peridot Capitalist.
I created below a long term chart based on 10 year rolling earnings for the S&P500. The chart shows the PE, the average and a one standard deviation band. To discuss the findings further I added as well the YoY change in CPI.


Key findings:
(1) The 48 year average is roughly 22x 10 year rolling earnings.
(2) The current level of 15x is ca one standard deviation below the average. The last time it was so low was in the 70's.
(3) Indeed in the 70's this metrics was lower fluctuating between 15 and 10x. Note though that during that period inflation was much higher than currently.
(4) The market bottomed in 82 at 10x 10 year rolling earnings
(5) The Internet bubble is clearly visible. Interestingly the recent bull run from 2002 to 2007 happened at a valuation ca one standard deviation above the long term average.
(6) Interpretations of the apparently low level of valuation based on 10 year rolling earnings?
(a) Past 10 year earnings were inflated
(b) Future earnings will remain lower for longer
(c) The market is cheap

Saturday, February 14, 2009

Earnings

The downturn is taking its toll on earnings. Marketwatch recently reported that quarterly earnings for the S&P500 will be negative for the first time ever. Here is a chart tracking the S&P500 and 12 months rolling earnings based on the monthly PE ratio reported by S&P. (The S&P500 closed in Dec at 903.25, for that month S&P then reported a monthly PE on 12M rolling earnings of 19.59 implying 12MrE of 46. Note however that earnings get revised after the monthly PE has been published and hence for recent data this earnings series differs from the bottom up estimates that S&P reports here)


12 months rolling earnings are now ca 46 down 46% from the peak of 85 reached in June 2007.
The current correction in earnings is already among the most severe as the following chart of log earnings illustrates and it does not yet consider the latest revisions. Using the last reported bottom up estimates of ca 30 the drop would be even larger.

An old post from Bespoke shows how drastic the cuts to earnings have been. At the end of Ocotober 2008 they wrote: "So where are earnings likely to come in next year? One of the more bearish forecasts making the rounds is that earnings for the S&P 500 will come in at $60 per share next year." This has now been reduced drastically, S&P sees 2009 reported earnings to be roughly 42. S&P also reported its bottom up earnings estimates for 2008. Here they are by sectors:

2008E
S&P 500 29.64
S&P 500 Consumer Discretionary (8.63)
S&P 500 Consumer Staples 15.37
S&P 500 Energy 38.62
S&P 500 Financials (25.39)
S&P 500 Health Care 19.72
S&P 500 Industrials 19.05
S&P 500 IT 13.43
S&P 500 Materials 1.92
S&P 500 Telecom 7.60
S&P 500 Utilities 12.55