
Showing posts with label Timing. Show all posts
Showing posts with label Timing. Show all posts
Thursday, April 30, 2009
Great Back to Back Months - What's Next?
April is over and it was a great month for the S&P500 (the second in a row!) with the index closing up 9.4% after up 8.5% in March. This is the best two months streak since 1950. Since then we've had only three two months periods with the S&P up more than 15%. Here is a look at how the market fared after such episodes. (indexed to 100 just before the 2 months streak!)


Thursday, March 19, 2009
Investing when down 50% from the past peak
I was intrigued by Jeremy Siegel's latest comment in Knowledge@Wharton that "once the market has fallen 50% your future returns are even better". So I went back to the data (monthly S&P500 close going back to Jan 1950) and found out that:
(1) Prior to the current crash and using month end data since Jan 50 the S&P 500 never had dropped by 50%.
(2) I therefore looked at 1year, 3 year, 5year and 10 year performances post a drop from the past peak of 40%. Since 1950 only nine months have been 40% below the past peak. It has then indeed paid off to invest as the following tables illustrates. Interestingly no negative performances were registered so far (see note below). It seems hence to be a rare and relatively safe opportunity.
Note that the jury on the 10 year performance following the 2000-2002 bear market is still out though it is not looking too good.
The table above compares the performances following the few occurences when the maket had dropped 40% to the average performances of all 1, 3, 5 and 10 year periods since Jan 1950.
Will have to look further using Shiller's data and real returns.
(1) Prior to the current crash and using month end data since Jan 50 the S&P 500 never had dropped by 50%.
(2) I therefore looked at 1year, 3 year, 5year and 10 year performances post a drop from the past peak of 40%. Since 1950 only nine months have been 40% below the past peak. It has then indeed paid off to invest as the following tables illustrates. Interestingly no negative performances were registered so far (see note below). It seems hence to be a rare and relatively safe opportunity.
| -40% from Peak | 1 YEAR | 3YEAR | 5YEAR | 10YEAR |
| Average | 29% | 46% | 65% | 146% |
| Min | 19% | 36% | 52% | 134% |
| Max | 36% | 53% | 87% | 161% |
| St Dev | 6% | 7% | 11% | 14% |
| All periods | ||||
| Average | 9% | 28% | 51% | 125% |
| Min | -45% | -43% | -36% | -41% |
| Max | 53% | 120% | 220% | 371% |
| St Dev | 20% | 30% | 48% | 88% |
Note that the jury on the 10 year performance following the 2000-2002 bear market is still out though it is not looking too good.
The table above compares the performances following the few occurences when the maket had dropped 40% to the average performances of all 1, 3, 5 and 10 year periods since Jan 1950.
Will have to look further using Shiller's data and real returns.
Monday, March 2, 2009
Calling a bottom?
CrossingWallstreet explains why "Trying to pick the bottom, however, is a dangerous undertaking and is, in his opinion, best left alone".
With the market making new lows Prof James Hamilton has an excellent post on stock prices and fundamentals trying to answer the question: "How low can stock prices go, and how worried should you be?"
He uses a Dividend Discount Model under two scenarios (1) real dividend grow 2% from the last reported value (2) dividends first follow the same path as during the great depression and then grow again.

Figure 4.Black line: actual stock price. Blue line: perfect-foresight price P*(t) under scenario 1. Green line: perfect-foresight price under scenario 2 (Great Depression II with dividends taking the same path as between 1931 and 1936)
According to Prof Hamilton at 608 the S&P500 would price in the same dividend trajectory as during the great depression and 5.5% real annual returns forever.
At a level of 735 and assuming the market drops to 608 before recovering the market is pricing in 3.6% real return over 10 years. Not bad.
His conclusion: "Of course, under this scenario you would do better waiting for the market to recognize the depression and wait to buy at 608 rather than now at 735. Moreover, given the historical tendency for over exuberance in upswings and excessive pessimism in downturns, you might expect the actual price to fall well below 600 in another depression, at which point there will be returns to be had well in excess of 5.5% if you time your moves just so.
With the market making new lows Prof James Hamilton has an excellent post on stock prices and fundamentals trying to answer the question: "How low can stock prices go, and how worried should you be?"
He uses a Dividend Discount Model under two scenarios (1) real dividend grow 2% from the last reported value (2) dividends first follow the same path as during the great depression and then grow again.
Figure 4.Black line: actual stock price. Blue line: perfect-foresight price P*(t) under scenario 1. Green line: perfect-foresight price under scenario 2 (Great Depression II with dividends taking the same path as between 1931 and 1936)
According to Prof Hamilton at 608 the S&P500 would price in the same dividend trajectory as during the great depression and 5.5% real annual returns forever.At a level of 735 and assuming the market drops to 608 before recovering the market is pricing in 3.6% real return over 10 years. Not bad.
His conclusion: "Of course, under this scenario you would do better waiting for the market to recognize the depression and wait to buy at 608 rather than now at 735. Moreover, given the historical tendency for over exuberance in upswings and excessive pessimism in downturns, you might expect the actual price to fall well below 600 in another depression, at which point there will be returns to be had well in excess of 5.5% if you time your moves just so.
But good luck with carrying out that particular scheme. After all, scenario 2 assumed we're about to start another Great Depression, and hopefully it goes without saying that this need not necessarily happen. If it doesn't, you may find yourself waiting for the S&P to fall below 600 until you're both retired and dead. If the downside to investing now, even under the depression scenario, is better than a 3% average real rate of return over the next decade, I can live with that."
Note: here is a link to an older post on investments.
Sunday, February 15, 2009
Earnings and valuation
The drop in earnings animates the discussions. See Barry Ritholz first with a very provocative target for the S&P500 and the response by Peridot Capitalist.

I created below a long term chart based on 10 year rolling earnings for the S&P500. The chart shows the PE, the average and a one standard deviation band. To discuss the findings further I added as well the YoY change in CPI.

Key findings:
(1) The 48 year average is roughly 22x 10 year rolling earnings.
(2) The current level of 15x is ca one standard deviation below the average. The last time it was so low was in the 70's.
(3) Indeed in the 70's this metrics was lower fluctuating between 15 and 10x. Note though that during that period inflation was much higher than currently.
(4) The market bottomed in 82 at 10x 10 year rolling earnings
(5) The Internet bubble is clearly visible. Interestingly the recent bull run from 2002 to 2007 happened at a valuation ca one standard deviation above the long term average.
(6) Interpretations of the apparently low level of valuation based on 10 year rolling earnings?
(a) Past 10 year earnings were inflated
(b) Future earnings will remain lower for longer
(c) The market is cheap
Saturday, February 7, 2009
Worst 10 year stretch ever for real S&P500 returns
Floyd Norris explains that the 10 years ending January 2009 have been the worst ever for annual real returns of the S&P500: "Over the 10 years through January, an investor holding the stocks in the S.& P.’s 500-stock index, and reinvesting the dividends, would have lost about 5.1 percent a year after adjusting for inflation, as is shown in the accompanying chart. 
Mr Norris adds "Many things influence stock prices, of course, and there is no guarantee that continued economic and financial woes will not drive the market down from here. But long-term investors may be able to take comfort from the fact that bad decades are often followed by 10-year periods that are better than the long-term average, which shows a gain of 6.2 percent a year." Looking at the chat above confirms this. In the past keeping stocks for 10 years after a negative 10 years streak usually provided positive real returns.
Until now, the worst 10-year period, by that measure, was the period that ended September 1974, with a compound annual decline of 4.3 percent.
That decline was strongly influenced by inflation. Ignoring inflation, stocks over that decade returned half a percent a year, not a very good showing but not a loss. But with inflation taking off, the real, inflation-adjusted return was negative.
For the current period, the total return was negative, at minus 2.6 percent a year, even before factoring in inflation."Mr Norris adds "Many things influence stock prices, of course, and there is no guarantee that continued economic and financial woes will not drive the market down from here. But long-term investors may be able to take comfort from the fact that bad decades are often followed by 10-year periods that are better than the long-term average, which shows a gain of 6.2 percent a year." Looking at the chat above confirms this. In the past keeping stocks for 10 years after a negative 10 years streak usually provided positive real returns.
Thursday, February 5, 2009
"Buffett's metric says it's time to buy"
Mr Buffett has been buying stocks of late. According to Fortune here is one of his metrics:
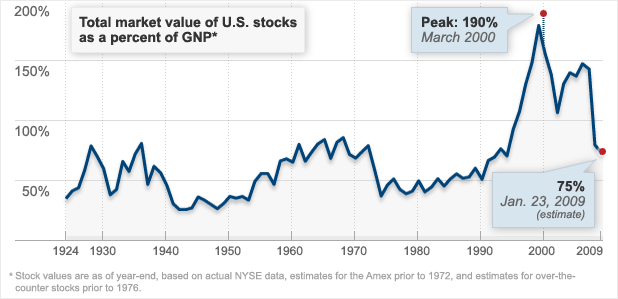
They quote the Sage of Omaha as saying "If the percentage relationship falls to the 70% to 80% area, buying stocks is likely to work very well for you."
Subscribe to:
Posts (Atom)


 Posts


