James Montier at GMO has an interesting white paper on margins arguing that "what goes up must come down".
Starting from the the equation that income=expenditures and decomposing each side further he comes to the following defintion of profits:
Profits = Investment – Household Savings – Government Savings – Foreign Savings + Dividends
(explanations here)
He then shows that since roughly the peak in the market 2006/2007 the contribution to margins from the rising budget deficit has been substantial.
Watch those margins when budget deficit reduction measures are implemented.
Showing posts with label Margins. Show all posts
Showing posts with label Margins. Show all posts
Tuesday, May 1, 2012

Sunday, April 1, 2012
Margins
Hussman has a very interesting chart showing margins and subsquent 5 year earnings growth. Usually the higher the margins the lower the subsequent growth in earnings.
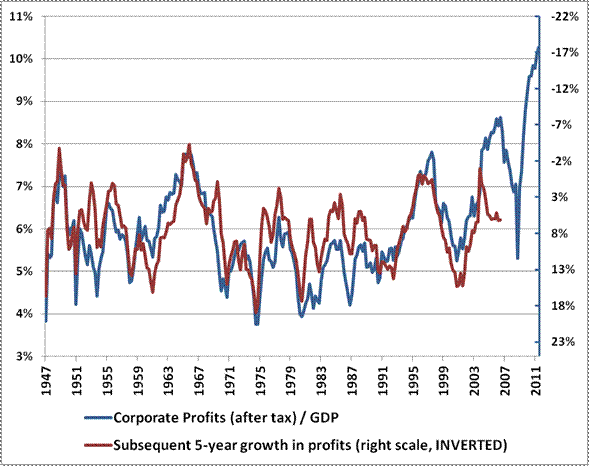
The most recent data show however that earnings have kept growing though margins were already very high. Buttonwood tries to explain why. Normally high margins and profits attract investments and competition and hence lower margins and profits. But currently investment is still low enabling companies to continue to earn unusually high profits. Hence the record high margins.
Here is a chart showing gross domestic investment and gdp indexed to 100 in December 2007. Investment has not yet recovered but it is catching up.

Beware the margin reversal.
The most recent data show however that earnings have kept growing though margins were already very high. Buttonwood tries to explain why. Normally high margins and profits attract investments and competition and hence lower margins and profits. But currently investment is still low enabling companies to continue to earn unusually high profits. Hence the record high margins.
Here is a chart showing gross domestic investment and gdp indexed to 100 in December 2007. Investment has not yet recovered but it is catching up.
Beware the margin reversal.
Tuesday, October 6, 2009
S&P500 Fair Value
Eddy Elfenbein at CrossingWallstreet sums it up:
"For 2009, the S&P 500 will make around $55 to $60 a share. For 2010, earnings will probably be around $75 a share. For 2011, and now it’s starting to become hard to forecast, Wall Street sees earnings at $92 a share.
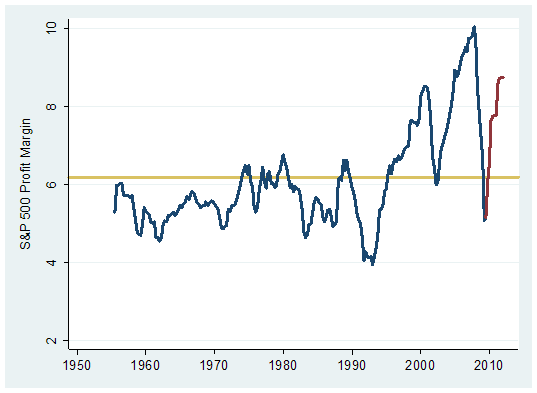
If that’s correct, then the stock market is still pretty inexpensive. At 15 times earnings, $92 a share translates to 1380 for the index by the end of 2011. If we discount that by 8% to today (I get 8% by adding a 3% premium to 5% which is about where AAA corporates are), we get 1160."At Hussman Funds Bill Hester appears less optimistic arguing that analysts now expect margins to recover to peak level, an unlikely scenario in a lower growth environment.
Friday, April 17, 2009
Corporate Profits to GDP Ratio
Via Zerohedge a chart of corporate profit to GDP ratio.
ZH then posts this comment: "Look at the nearby chart, which presents National Account profits relative to GDP – a proxy for margins. People who look at the earnings plunge and deem this to have been the worst setback ever and note how we have broken all the peak-totrough declines in the past fail to take into account the starting point – the profit-to- GDP ratio at the 2006 peak hit an all-time high of 10.9% – not once did it ever even cross above the 10% threshold in the 60-year history of the data. A normal peak was typically around 7%, and today it is 6.6% – after the sharp slide this cycle, it is actually close to prior bull market peaks, believe it or not. The average recession trough is 4.6%, so on that basis we are basically two-thirds of the way though the margin compression phase and seeing as we think nominal growth is likely to be flat over the next two years, a complete normalization of this ratio would imply a further 30% downside potential for corporate profits. Applying that to S&P 500 operating earnings would actually put them at risk of bottoming at $35 at some point over the next two years, which in turn means we have a forward multiple of very close to 25x, which is simply too rich for our liking."
ZH then posts this comment: "Look at the nearby chart, which presents National Account profits relative to GDP – a proxy for margins. People who look at the earnings plunge and deem this to have been the worst setback ever and note how we have broken all the peak-totrough declines in the past fail to take into account the starting point – the profit-to- GDP ratio at the 2006 peak hit an all-time high of 10.9% – not once did it ever even cross above the 10% threshold in the 60-year history of the data. A normal peak was typically around 7%, and today it is 6.6% – after the sharp slide this cycle, it is actually close to prior bull market peaks, believe it or not. The average recession trough is 4.6%, so on that basis we are basically two-thirds of the way though the margin compression phase and seeing as we think nominal growth is likely to be flat over the next two years, a complete normalization of this ratio would imply a further 30% downside potential for corporate profits. Applying that to S&P 500 operating earnings would actually put them at risk of bottoming at $35 at some point over the next two years, which in turn means we have a forward multiple of very close to 25x, which is simply too rich for our liking."
Subscribe to:
Posts (Atom)


 Posts
Posts

