Sunday, September 1, 2013

An Emerging Market Crisis?

At first Prof Krugman had a rather reassuring view on the INR weakness even concluding "So at first examination this doesn’t look like as big a deal as some headlines are suggesting". He also had a good explanation for the current weakness of em assets: "We more or less know the story here. First, advanced countries plunged into a prolonged slump, leading to very low interest rates; capital flooded into emerging markets, causing currency appreciation (or, in the case of China, real appreciation via inflation). Then markets began to realize that they had overshot, and hints of recovery in advanced countries led to a rise in long-term rates, and down we went."

But here is a list of op-eds that are much less optimistic and that suggest further adjustments may be in the cards.

Back in July Trouble in emerging market paradise by Nouriel Roubini who concluded "These factors explain why growth in most BRICS and many other emerging markets has slowed sharply. Some factors are cyclical, but others – state capitalism, the risk of a hard landing in China, the end of the commodity super-cycle – are more structural. Thus, many emerging markets’ growth rates in the next decade may be lower than in the last – as may the outsize returns that investors realized from these economies’ financial assets (currencies, equities, bonds, and commodities).
Of course, some of the better-managed emerging-market economies will continue to experience rapid growth and asset outperformance. But many of the BRICS, along with some other emerging economies, may hit a thick wall, with growth and financial markets taking a serious beating."

A bumpy ride for emerging markets from Laura Tyson with a key message "when the Fed tightens monetary policy to manage macroeconomic conditions in the US, there are large unintended spillover effects on capital flows to emerging markets". Though EM are nowadays better equipped to weather the storm than in the past she mentions "some countries are at risk, especially those with large current-account deficits, large foreign capital inflows relative to the size of their financial markets, and low foreign-exchange reserves. Among the most vulnerable are Turkey, South Africa, Brazil, India, and Indonesia – a group that Morgan Stanley researchers have dubbed the “Fragile Five.""

The end of the emerging market party from Ricardo Hausmann who concludes "The same dynamics that inflated the dollar value of GDP growth in the good years for these countries will now work in the opposite direction: stable or lower export prices will reduce real growth and cause their currencies to stop appreciating or even weaken in real terms. No wonder the party is over."

Danny Leipziger on Brazil's growth imperative which states: "Brazil has lost its swagger. Growth estimates for this year put Latin America’s largest economy above only Venezuela and El Salvador in the region, and the outlook for next year is not much better. Brazil’s currency, the real, has fallen to its lowest level against the US dollar in more than four years, compelling the government to pump billions of dollars into the foreign-exchange futures market and raise interest rates to deter capital outflows – just a few years after imposing a new tax to deter inflows."

Abenomics for Asia by Yuriko Koike who concludes: "Sixteen years ago, the Asian financial crisis erupted, following the Thai government’s decision to float the baht in the face of speculative attacks. The response of governments to that crisis has shaped much of the region’s economic policymaking ever since. If Asia is to avoid another crisis on a similar scale, or lost decades of growth, its governments will need to embrace the type of all-encompassing reforms that Japan is undertaking. Abenomics, it seems, is for everyone."

The Global QE Exit crisis by Stephen S. Roach who concludes: "Where this stops, nobody knows. That was the case in Asia in the late 1990’s, as well as in the US in 2009. But, with more than a dozen major crises hitting the world economy since the early 1980’s, there is no mistaking the message: imbalances are not sustainable, regardless of how hard central banks try to duck the consequences. Developing economies are now feeling the full force of the Fed’s moment of reckoning. They are guilty of failing to face up to their own rebalancing during the heady days of the QE sugar high."

And finally Brad DeLong commenting on Mrs Tyson's piece above sums it up nicely: "The fear is, as Rudy Dornbush used to put it, that India and other emerging markets are right now not North Atlantic but rather South American economies".

A case of multiple equilibria? One day half full and filling up and the next half empty and leaking fast.


Monday, May 6, 2013

Europe Now vs 1929

Paul Krugman notes "in Europe, recovery is now behind where it was at the same point of the Great Depression. Here’s European industrial production from the League of Nations starting in 1929 and Eurostat starting in 2007"


Tuesday, February 19, 2013

Bull Market Ahead?

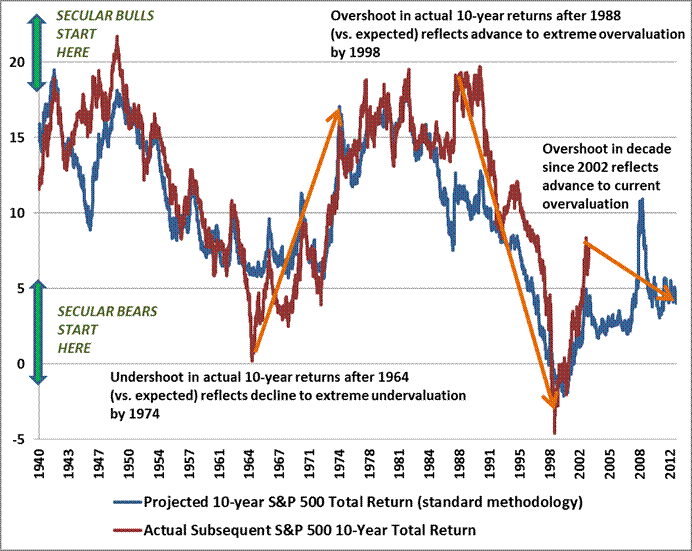
After the run we've witnessed in equity markets since March 2009 Dr. Hussman provides a verty interesting market commentary where he explains: "Simply put, secular bull markets begin at valuations that are associated with subsequent 10-year market returns near 20% annually. By contrast, secular bear markets begin at valuations like we observe at present."
Visually based on the simple formula Shorthand 10-year total return estimate = 1.06 * (15/ShillerPE)^(1/10) – 1 + dividend yield(decimal).
 
Hussman explains further "Presently, the Shiller P/E is 22.7, with a dividend yield of 2.2%. Do the math. A plausible, and historically reliable estimate of 10-year nominal total returns here works out to only 1.06*(15/22.7)^(.10)-1+.022 = 3.9% annually".

Sunday, August 12, 2012

What's the middle class?

Interesting article on the difficulties of defining the middle class. Here is Brazil's according to different sources:

Using 10$ to 50$ PPP income per day here is how they look for different countries:


Tuesday, May 1, 2012

Margins

James Montier at GMO has an interesting white paper on margins arguing that "what goes up must come down".
Starting from the the equation that income=expenditures and decomposing each side further he comes to the following defintion of profits:

Profits = Investment – Household Savings – Government Savings – Foreign Savings + Dividends
(explanations here)
He then shows that since roughly the peak in the market 2006/2007 the contribution to margins from the rising budget deficit has been substantial.

Watch those margins when budget deficit reduction measures are implemented.

Sunday, April 1, 2012

Margins

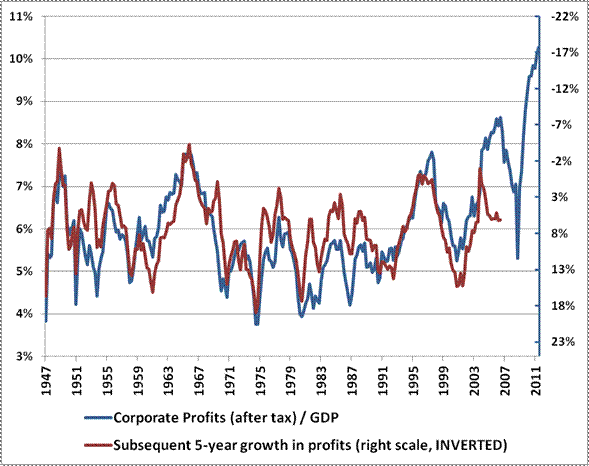
Hussman has a very interesting chart showing margins and subsquent 5 year earnings growth. Usually the higher the margins the lower the subsequent growth in earnings.

The most recent data show however that earnings have kept growing though margins were already very high. Buttonwood tries to explain why. Normally high margins and profits attract investments and competition and hence lower margins and profits. But currently investment is still low enabling companies to continue to earn unusually high profits. Hence the record high margins.

Here is a chart showing gross domestic investment and gdp indexed to 100 in December 2007. Investment has not yet recovered but it is catching up.


Beware the margin reversal.

Friday, February 24, 2012

Chinese Migration

A nice little video on Chinese migration from the economist.

Wednesday, February 15, 2012

Ugly Bond Math

A very intersting chart from EconomPic comparing current market yield and 5 year forward returns. With an index duraion of roughly 5 in the us both data sets track each other closely.

Thursday, January 12, 2012

Fuel Prices and Fuel Consumption

Econbrowser highlights this chart from a recent research paper on how to reduce petroleum consumption from transportation.

Wednesday, January 4, 2012

MIT Open Course Ware

http://ocw.mit.edu/courses/#sloan-school-of-management

Am definitely following Introduction to computer science and programming this year and I look forward to a certificate of completion from MITx.

A List of Good Companies

According to Crossingwallstreet, rated by CNN as the best buy and hold blogger

Company Symbol
Abbott Laboratories ABT
AmerisourceBergen ABC
AT&T T
AutoZone AZO
Balchem BCPC
Ball BLL
Baxter International BAX
Becton Dickinson BDX
Biogen Idec BIIB
C.H. Robinson Worldwide CHRW
Cerner CERN
Charles Schwab SCHW
Church & Dwight CHD
Clorox CLX
Coach COH
Coca-Cola KO
Cognizant Technology Solutions CTSH
Colgate-Palmolive CL
Community Health Systems CYH
Compuware CPWR
Costco Wholesale COST
Cummins CMI
CVS Caremark CVS
Danaher DHR
Darden Restaurants DRI
DaVita DVA
Deluxe DLX
Dentsply International XRAY
Dolby Laboratories DLB
Donaldson DCI
Expeditors International EXPD
Express Scripts ESRX
FactSet Research Systems FDS
Fair Isaac FICO
Fastenal FAST
FLIR Systems FLIR
Flowers Foods FLO
Flowers Foods FLO
FMC Technologies FTI
Forest Laboratories FRX
General Dynamics GD
Gilead Sciences GILD
Graco GGG
Hasbro HAS
Hormel Foods HRL
Hospira Inc HSP
Humana HUM
IBM IBM
Infosys Limited INFY
Intel INTC
IntercontinentalExchange ICE
Internationa Flavors & Fragrances IFF
Intuit INTU
Intuitive Surgical ISRG
Iron Mountain IRM
J.M. Smucker SJM
L-3 LLL
Lincare LNCR
ManTech MANT
McCormick MKC
McDonald’s MCD
Microsoft MSFT
Nike NKE
Progressive PGR
Public Storage PSA
Quest Diagnostics DGX
Raven Industries RAVN
RLI Corp. RLI
Ross Stores ROST
Seaboard SEB
SEI Investments SEIC
Seneca Foods SENEA
Sigma-Aldrich SIAL
Snap-On SNA
St. Jude Medical STJ
Starbucks SBUX
State Street STT
Stericycle SRCL
Target TGT
Teradata TDC
Thermo Fisher TMO
Tiffany TIF
TJX TJX
U.S. Bancorp USB
United Technologies UTX
V.F. Corporation VFC
Varian Medical Systems VAR
Visa V
W.W. Grainger GWW
Walgreen WAG
Waters WAT
WellPoint WLP
Wells Fargo WFC
Western Union WU
Weyco WEYS
Yum! Brands YUM
Zimmer ZMH

Tuesday, January 3, 2012

Shanghai 1990 and 2010


http://www.theatlantic.com/business/archive/2011/01/picture-of-the-day-shanghai-in-1990-and-2010/69959/

H/T Brad DeLong for the link

Monday, January 2, 2012

Outlook 2012

Here are Wall Street's 2012 forecasts for the S&P 500. Bloomberg has the details here.
The mean forecast is 1348, up a tad more than 7% from the current level. Last year the pros were too optimistic forecasting an 9% rise while the market has been flat in 2011. They thought the S&P 500 would move to 1382 with a 2011 EPS of 93. They now think the market will move less with a 2012 EPS 10% higher. Not a lot of enthusiasm here.
The strategists have been right on the EPS side just a tad cautious but the market did not move with lots of risk aversion. If they are correct on the earnings side again and animal spirits return they could for once be too pessimistic. Let's check that in a year.


Firm                 Strategist           2012 Close   2012 EPS
==============================================================
Bank of America Savita Subramanian 1,350 $104.50
Bank of Montreal Ben Joyce 1,325 $102.00
Barclays Barry Knapp 1,330 $103.00
Citigroup* Tobias Levkovich 1,375 $101.00
Credit Suisse Andrew Garthwaite 1,340
Deutsche Bank Binky Chadha 1,500 $106.00
Goldman Sachs David Kostin 1,250 $100.00
HSBC Garry Evans 1,190
JPMorgan Thomas Lee 1,430 $105.00
Morgan Stanley Adam Parker $103.20
Oppenheimer Brian Belski 1,400 $101.00
RBC Myles Zyblock $101.00
UBS** Jonathan Golub 1,325 $99.00
Wells Fargo Gina Martin Adams 1,360 $101.99
---------------------------------------------------------------
Mean 1,348 $102.31
Median 1,345 $102.00
High 1,500 $106.00
Low 1,190 $99.00

Thursday, August 18, 2011

PGA and Statistics

Came across this interesting collection of papers on golf statistics.
The Wharton paper on Loss Aversion is very interesting. Golf pros put better for par than for birdie. A bias that cost the best players 1.2m in prize money a year.
Pros also make 99.2% of the puts of 3 feet or less, pros make less than 50% of puts longer than 8 feet.


Thursday, June 9, 2011

This looks so easy

Oil Demand exceeds production

Don't blame speculators for the high oil price. Here is a chart from the economist showing how oil consumption now exceeds production.

Wednesday, March 9, 2011

Oil Copper Spread

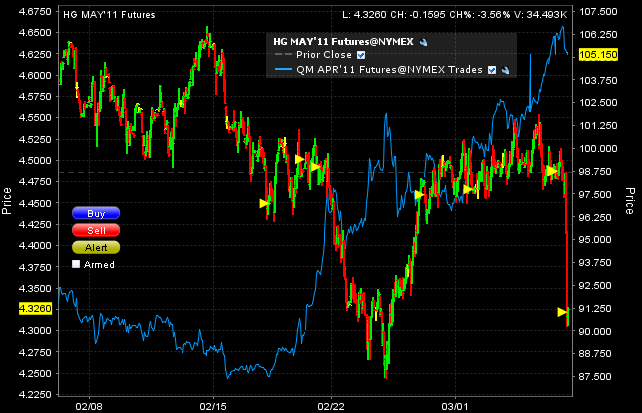
Prof Krugman highlights the following chart:

Copper is mainly driven by economic factors while oil both by eco and geopolitical risks and both commodities now seem to tell a different story.