Wednesday, September 23, 2009

Sometimes I wish I was a student again...

... taking Brad de Long's exam:

No calculators allowed, You won’t need them. All you will need is simple arithmetic (the ability to multiply things by two, and to divide) and the rule of 72—the fact that a quantity growing at 1% per year doubles in 72 years, a quantity growing at 2% per year doubles in 36 years, a quantity growing at 0.5% per year doubles in 144 years, et cetera, a quantity growing at 1% per year grows by 41.41% in 36 years, etc…

PART 3 (25 MINUTES): Calculations

Consider the 144 years between 1866 and 2010…

  1. World population grew from about 1.1 billion to 6.4 billion. About how many doublings did population undergo? What is the average growth rate of world population over those 144 years?
  2. World total real GDP (on one somewhat arbitrary set of assumptions, at least) grew from $875 billion of today’s dollars in 1866 to $56 trillion of today’s dollars today. What was the average growth rate of world total real GDP over those 144 years?
  3. If world total real GDP growth continues to grow at its average 1866-2010 rate, what will world total real GDP (in today’s dollars) be in 2155? Do you think this is possible? Reasonable? Absurd? Why?
  4. By contrast, total world GDP (on one somewhat arbitrary set of assumptions, at least) grew from $437.5 billion of today’s dollars in 1794 to $875 billion of today’s dollars in 1866. Suppose total world real GDP growth had continued at its 1794-1866 pace from 1866-2010. What would total world real GDP be today?

If I follow correctly. 2. implies 6 doublings in 144 years or an annual growth rate of 3%.
4. implies a growth rate of 1% (1 doubling in 72 years) continuing at that pace for an other 144 years the economy would have experienced two doublings to 3.5 trillion, not even 10% of today's size. Amazing!

Monday, September 21, 2009

"The Anarchy of Success"

Two book reviews in one by William Easterly at Aidwatch. The blog summary is here but the long piece is well worth reading.
In development economics beware of
Pattern in the clouds ("Humans are suckers for finding patterns where none really exist, like seeing the shapes of lions and giraffes in the clouds.")
Confirmation Bias ("When the evidence is mixed, we tend to select the parts of the evidence that confirm what we already believe")
Law of Small Numbers ("our tendency to judge performance by too small a slice of experience")

Key conclusions from Easterly:
"One way to escape from the Law of Small Numbers is to seek to explain levels of per capita income already attained today rather than rates of growth. The level of income you have reached today frees you from small numbers because it reflects the outcome of your entire previous growth experience. So let's ask, who are the richest and the poorest countries now, and what is the difference between them? I argued above that the now-rich countries leaped ahead during a long period in which they were more free-trade and free-market (although far from laissez-faire) than the rest of the world. Economists therefore have a much higher degree of consensus on this question—both evidence and intuition suggest that such things as education, private property, contract enforcement, and freedom from government expropriation contribute to economic development.
These findings just confirm the Western consensus around the basic concept of a state shaped by representative democracy, safeguarding individual rights and supplying crucial infrastructure such as transport, while rewarding entrepreneurship and technological creativity. Such common-sense ideas have stood the test of time over the very long run, both in their acceptance by the population in most economically successful societies (compared to their absence and rejection in unsuccessful economies) and in their pragmatic consequences for prosperity (as showed by the comparison to the poverty of states that lack most of the above conditions). Development is too complex to fit these ideas 100 percent of the time, of course—there are authoritarian exceptions like Singapore. China is not yet an exception because its income level is still less than one tenth that of the US. We can conjecture that China's rapid change in income has followed positive changes in individual economic (and even some political) rights."

"Perhaps prosperity is not after all designed from above; perhaps it emerges from below, from the independent actions of many individuals who figure out their own paths."

In the end, Korea didn't need experts like Ha-Joon Chang as much it needed entrepreneurs like Ju-Yung Chung. Chung was the son of North Korean peasant farmers, who had to leave school at fourteen to support his family. He had failed at successive jobs as a railway construction laborer, a dockhand, a bookkeeper, and a deliveryman for a rice shop in Seoul. At age twenty-two, he took over the rice shop, but it failed. He started A-Do Service Garage to do auto repair, which also failed. At age thirty-one in 1946 in Seoul, Chung again started an auto service, which finally became his first successful business. That auto service grew and diversified over the years. It is now known as Hyundai."

Sunday, September 20, 2009

Thomas Friedman on Renewable Energy

His Op Ed is here. I quote: "Here is what is indisputable: The world is on track to add another 2.5 billion people by 2050, and many will be aspiring to live American-like, high-energy lifestyles. In such a world, renewable energy — where the variable cost of your fuel, sun or wind, is zero — will be in huge demand.China now understands that. It no longer believes it can pollute its way to prosperity because it would choke to death. That is the most important shift in the world in the last 18 months. China has decided that clean-tech is going to be the next great global industry and is now creating a massive domestic market for solar and wind, which will give it a great export platform"

Industrial production to bounce back?

Econbrowser in a great post on the current economic conditions posts the following chart from angry bear. According to this chart it appears the more severe the downturn in IP the stronger the rebound.

Friday, September 18, 2009

Global Oil demand per Capita: 4.6barrels/person/year

Thanks Morgan Downey for the info:

Two unrelated oil charts

First from this week's economist I was surprised to see that petrol prices are actually higher in China than in the US:


Second via FT Alphaville a great chart from Morgan Downey on Oil in tankers floating around the world.

Thursday, September 17, 2009

V-Shape or Double Dip?

Paul Krugman illustrates very well why the risks of a double dip are real.
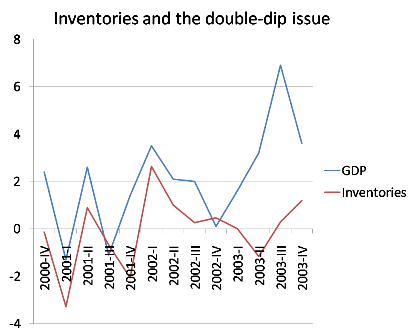
"There’s a tendency to treat worries about a double dip as outlandish, as something only crazy people like the people who, um, predicted the current crisis worry about. But there are some real reasons for concern. One is that the lift from fiscal stimulus will start to fade out in a couple of quarters. Another is that, as Yellen points out, most of the boost we’re getting now is tied to inventories. And that’s a one-time thing. You don’t have to look back very far to see just how transitory an inventory-led boost can be. The figure below shows growth before, during, and after the 2001 recession, together with the contribution of inventory changes to growth. Notice the boost from 2001IV to 2002I from inventories, then the fading out that almost, but not quite, turned into contraction later in 2002. It wasn’t literally a double-dip, W-shaped recession, but it came close.

Econbrowser more optimistically points towards Deutsche Bank's "credit impulse" indicator indicating a V-shape recovery. "Deleveraging implies slow growth in total credit, and according to the usual reasoning, slow growth in GDP. Several of Deutsche Bank's economists, however, focus on what they call the credit impulse. They provide the following provocative graph, which suggests a rapid recovery:"


Tuesday, September 15, 2009

World Oil: Market or Mayhem?

Came across this great paper by James L. Smith on the world oil market. The author addresses the following questions:
(1) Why are oil prices so volatile?
(2) What is OPEC and what does OPEC do?
(3) What is the equilibrium price of oil?
(4) Is “peak oil” a genuine concern?
(5) Why did oil prices spike in 2008, and what role (if any) did speculators play?

Lots a of great infos in there that I quote below.
(1) Oil price volatility - "What creates high volatility, for both oil and gas, is the inelasticity of demand and supply, plus the substantial lead times required to efficiently alter the stock of fuelconsuming equipment, or to augment the productive capacity of oil and gas fields. Volatility provides incentives for holding large inventories, but since inventories are costly, they cannot fully offset the rigidity of demand and supply.

Empirical estimates of the price elasticity of demand for crude oil vary by place, time, and statistical technique. Estimates of -0.05 (short-run) and -0.35 (long-run) are typical, with several years required to complete the adjustment to a permanent price change.

Income elasticities of demand for crude oil appear to vary significantly by level of income, with near proportional growth in oil demand in many developing countries (EI ≈ 1.00), but much slower growth in the industrialized world (EI ≈ 0.50). It follows that future growth of demand for oil, and therefore the equilibrium price level, hinges on economic growth rates in China, India, etc.

It is more difficult to produce current and reliable estimates of the elasticity of crude oil supply, due in part to confounding effects of resource depletion and technical innovation, but there is consensus that the supply of conventional oil is inelastic. The U.S. Energy Information Administration uses elasticities of 0.02 (short-run) and 0.10 (long-run) for most regions in its international oil supply model.

(2) OPEC controls 70% of global oil reserves, OPEC’s goal is to set the price by (1) shutting in existing production capacity, and (2) limiting the growth of new capacity. According to Smith OPEC has mostly failed at the former, but succeeded at the latter.

Since the quota system was adopted in 1983, total OPEC production has exceeded the ceiling by 4% on average, but on numerous occasions the excess has run to 15% or more. In general, full compliance has been achieved only during episodes, like the present, when members have not had enough installed capacity to exceed their quotas; i.e., when it has been physically impossible to cheat on their production limits.

OPEC’s crude oil production capacity (33 mmb/d) is virtually unchanged from 1973, although the volume of proved reserves (i.e., known deposits that could have been tapped to expand capacity) doubled over that span. OPEC’s installed capacity is sufficient to extract just 1.5% of its proved reserves per year, which is another way of measuring the low intensity of development.

On the other hand, non-OPEC producers, working mostly in less prolific and more expensive petroleum provinces, have increased their production capacity by 69% since 1973, and installed sufficient facilities to extract 5.6% of their proved reserves each year.

OPEC accounted for only 10% of the petroleum industry’s upstream capital investment during the past decade, although it produced nearly half of global output

OPEC has recently initiated numerous projects to tap their under-developed reserves and finally expand capacity. $40 billion per year is budgeted for this going forward.

In 2007, the five largest international oil companies (the super-majors), who collectively own just 3% of global oil reserves, spent about $75 billion to develop new production capacity. OPEC, with about twenty times the reserves, spends only about half as much in absolute terms.

OPEC restraint is also reflected in the upstream plowback rate: in 2007, the super-majors reinvested 25% of their gross production revenues to expand capacity, whereas OPEC members are investing only about 6% of their net export revenues on such projects.

(3) Equilibrium Price of Oil: the author uses a simple model with Saudi Arabia as a Stackelberg leader—a producer who anticipates the reaction of consumers and all other (price-taking) producers, and who sets its own output (and price) accordingly. Solving with the then price level of 115 would imply marginal costs for Saudi Arabia of 83$, much high than most estimates of 5 to 15$.

Other model used such as depletion cannot explain the the then high price of oil. Could the reason lie on the supply side and hence the look at

(4) Peak Oil - The so-called “Hubbert curve” might have been forgotten altogether but for the
fact that Hubbert’s 1956 prediction that U.S. oil production would peak around 1970 was famously borne out. It should also be noted (but usually is not) that the predicted volume of oil to be produced at the peak was 37% too low, and that Hubbert’s predictions regarding coal and natural gas ran badly amiss.

Hubbert predicted that U.S. oil production would peak at 3 billion barrels per year; actual production in 1970 was 4.1 billion barrels. Hubbert predicted that U.S. gas production would peak at 14 trillion cubic feet per year in 1973; actual production was 20 trillion cubic feet in 2007. Hubbert predicted that global coal production will peak in 2150 at about 6.4 billion metric tonnes; actual production reached that level in 2007 and is still growing rapidly.

The crucial fact is that while oil is constantly being “used up” the world is not “running out” of oil. Indeed, Adelman and Watkins (2008) make a strong case that the depletable resource paradigm is not empirically relevant. Since its inception, the oil industry has endeavored to replace every barrel extracted from the earth by investing in new projects to find and develop additional resources, so far with great success. Despite our having consumed almost 700 billion barrels of crude oil during the past quartercentury, the volume of remaining proved reserves available to support future production has doubled since 1980 and now stands at an all-time high. The stock of proved reserves has grown even faster than production, which means that the “reserves to production ratio” has grown, and that we now extract a smaller fraction of remaining reserves each year than previously. The implication is undeniable: increasing physical scarcity, the currency of the peak oil club, can not have triggered oil’s recent ascent.

(5) Speculators - Relative to the size of the world oil market, hedge funds and the “super-major” oil companies are indeed small fry. To succeed at price fixing, one of two things would be required: (1) accumulating large private inventories that are diverted from the commercial supply chain; or (2) shutting in a significant portion of global oil production. Neither phenomenon has been observed."

Solar Crisis?

Via Paul Kedrosky a Digitimes article on the current solar panel oversupply.

The Information Network: Planned global solar capacity increases, 2008-2010

Item

2008

2009

2010

Solar consumption (MW)

5,625

4,894

6,215

Solar capacity (MW)

11,722

17,551

24,212

Utilization

48.0%

27.9%

25.7%

Inventory days

71

122

133

Source: The Information Network, compiled by Digitimes, September 2009

Expect prices to drop further "Average selling prices could drop below US$1 per watt in 2010 and US$0.50 in 2011. As many as 50% of the more than 200 solar manufacturers, mired in red ink with current selling prices above US$2.00 per watt, may not survive, The Information Network stated." These price drops will most likely help adoption and the industry leaders.

To put things in perspectives Global Energy Consumption is around 472 quadrillion Btu. (see BP or EIA) which equals to ca 15.8 TWyr as 1 TWyr = 8.76 x 10¹² kWh = 31.54 EJ = 29.89 quad.
Alternatively 1 barrel of crude oil = 6.0 million Btu and 1 million barrels of oil per day = 2.12 quadrillion Btu per year.

Here is the EIA's 2009 take on Solar technologies from which the following chart has been taken:

Tuesday, September 1, 2009

Nominal GDP and Earnings Growth

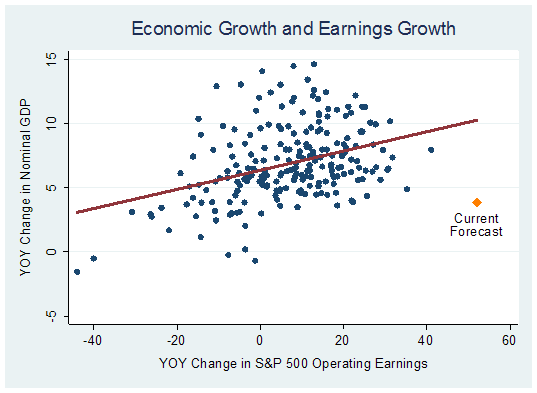
William Hester at Hussmanfunds has an interesting piece on nominal gdp and earnings growth. See chart below with the outlying current forecasts. In spite of the modest expected recovery operating earnigns are supposed to rebound strongly.
How important is the low base?
Is the relationship that strong once we remove the outliers in the bottom left corner?
Which variable is more likely to surprise? Eco on the upside or earnings on the downside?