Tuesday, October 13, 2009

No Walk the Talk for Exxon

As usual Econbrowser has a great post, this time on the difficulties of raising oil supply.
He writes: "The dark blue line in the figure below shows the company's production each year since 1999. Four years ago, Stuart Staniford noted that ExxonMobil's 2001 annual report predicted 3% annual growth in production between 2001 and 2007. That projection appears as the red line in the graph below; didn't quite come out as planned. Stuart's theory was that the company correctly predicted the contribution of its new discoveries, but underestimated the declining production rates from mature fields.

ExxonMobil again predicted in 2006 that it could achieve 3% annual growth over 2006-2011. I've shown that forecast as the lighter blue line in the figure. We still have two more years to make that one right, I suppose."


Monday, October 12, 2009

Krugman, Taylor Rule and Okun's Law

Very interesting post by Paul Krugman on why the Fed should not raise rates anytime soon.
Solving the Taylor Rule for a Fed Fund Target of 0% and the current inflation rate gives the unemployment rate level at which the fed should start raising rates.

The table below shows the different unemployment rates at which the fed should tighten assuming different inflation rates.

Change in PCE 0.0% 0.5% 1.0% 1.6% 2.0% 2.5% 3.0% 3.5% 4.0% 4.5% 5.0%
Unemployment 5.8% 6.2% 6.6% 7.0% 7.3% 7.7% 8.1% 8.4% 8.8% 9.2% 9.6%


Mr Krugman then looks at Okun's law which says that GDP growth 2 points above potential of 2.5% reduces unemployement by 1% and concludes: "So say we have 5 percent growth for the next 2 years — which would be hailed as a stunning boom. Even so, unemployment should fall only 2.5 points, to 7.3. In other words, even with a really strong recovery (which almost nobody expects), the Fed should keep rates on hold for at least two years."

Tuesday, October 6, 2009

S&P500 Fair Value

Eddy Elfenbein at CrossingWallstreet sums it up:

"For 2009, the S&P 500 will make around $55 to $60 a share. For 2010, earnings will probably be around $75 a share. For 2011, and now it’s starting to become hard to forecast, Wall Street sees earnings at $92 a share.

If that’s correct, then the stock market is still pretty inexpensive. At 15 times earnings, $92 a share translates to 1380 for the index by the end of 2011. If we discount that by 8% to today (I get 8% by adding a 3% premium to 5% which is about where AAA corporates are), we get 1160."

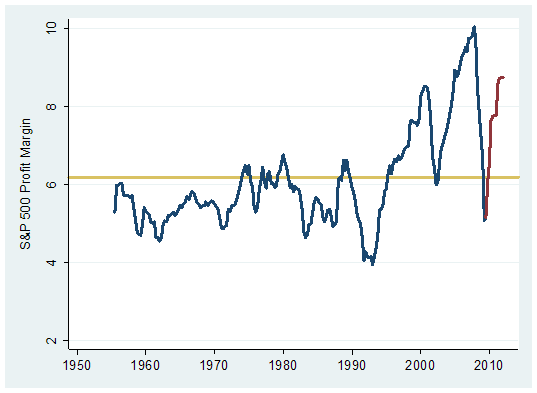
At Hussman Funds Bill Hester appears less optimistic arguing that analysts now expect margins to recover to peak level, an unlikely scenario in a lower growth environment.

Sunday, October 4, 2009

Lags between end of recession, unemployment rate peak and fed tightening

Macroblog offers the following table:

Historical lags between end of recession, unemployment rate peak, and beginning of funds rate tightening cycle

End of Recession Unempl.
rate peak
Beginning of funds rate tightening cycle Months from end of recession to unempl. peak Months from unempl. peak to beginning of funds rate tightening cycle
Nov 2001 Jun 2003 Jul 2004 19 13
Mar 1991 Jun 1992 Feb 1994 15 20
Nov 1982 Dec 1982 Jun 1983 1 6
(Jul 1980)


Mar 1975 May 1975 May 1976 2 12
Nov 1970 Aug 1971* Mar 1972 9 7
*Following the 1970 recession, the unemployment rate was 6.1 in December 1970 and again in August 1971. If the December 1970 peak is used, months from end of recession to unemployment peak is 1 and months from unemployment peak to beginning of funds rate tightening cycle is 15.
Source: Bureau of Labor Statistics, National Bureau of Economic Research, and Federal Reserve Board

Rates could stay low for a while

Wednesday, September 23, 2009

Sometimes I wish I was a student again...

... taking Brad de Long's exam:

No calculators allowed, You won’t need them. All you will need is simple arithmetic (the ability to multiply things by two, and to divide) and the rule of 72—the fact that a quantity growing at 1% per year doubles in 72 years, a quantity growing at 2% per year doubles in 36 years, a quantity growing at 0.5% per year doubles in 144 years, et cetera, a quantity growing at 1% per year grows by 41.41% in 36 years, etc…

PART 3 (25 MINUTES): Calculations

Consider the 144 years between 1866 and 2010…

  1. World population grew from about 1.1 billion to 6.4 billion. About how many doublings did population undergo? What is the average growth rate of world population over those 144 years?
  2. World total real GDP (on one somewhat arbitrary set of assumptions, at least) grew from $875 billion of today’s dollars in 1866 to $56 trillion of today’s dollars today. What was the average growth rate of world total real GDP over those 144 years?
  3. If world total real GDP growth continues to grow at its average 1866-2010 rate, what will world total real GDP (in today’s dollars) be in 2155? Do you think this is possible? Reasonable? Absurd? Why?
  4. By contrast, total world GDP (on one somewhat arbitrary set of assumptions, at least) grew from $437.5 billion of today’s dollars in 1794 to $875 billion of today’s dollars in 1866. Suppose total world real GDP growth had continued at its 1794-1866 pace from 1866-2010. What would total world real GDP be today?

If I follow correctly. 2. implies 6 doublings in 144 years or an annual growth rate of 3%.
4. implies a growth rate of 1% (1 doubling in 72 years) continuing at that pace for an other 144 years the economy would have experienced two doublings to 3.5 trillion, not even 10% of today's size. Amazing!

Monday, September 21, 2009

"The Anarchy of Success"

Two book reviews in one by William Easterly at Aidwatch. The blog summary is here but the long piece is well worth reading.
In development economics beware of
Pattern in the clouds ("Humans are suckers for finding patterns where none really exist, like seeing the shapes of lions and giraffes in the clouds.")
Confirmation Bias ("When the evidence is mixed, we tend to select the parts of the evidence that confirm what we already believe")
Law of Small Numbers ("our tendency to judge performance by too small a slice of experience")

Key conclusions from Easterly:
"One way to escape from the Law of Small Numbers is to seek to explain levels of per capita income already attained today rather than rates of growth. The level of income you have reached today frees you from small numbers because it reflects the outcome of your entire previous growth experience. So let's ask, who are the richest and the poorest countries now, and what is the difference between them? I argued above that the now-rich countries leaped ahead during a long period in which they were more free-trade and free-market (although far from laissez-faire) than the rest of the world. Economists therefore have a much higher degree of consensus on this question—both evidence and intuition suggest that such things as education, private property, contract enforcement, and freedom from government expropriation contribute to economic development.
These findings just confirm the Western consensus around the basic concept of a state shaped by representative democracy, safeguarding individual rights and supplying crucial infrastructure such as transport, while rewarding entrepreneurship and technological creativity. Such common-sense ideas have stood the test of time over the very long run, both in their acceptance by the population in most economically successful societies (compared to their absence and rejection in unsuccessful economies) and in their pragmatic consequences for prosperity (as showed by the comparison to the poverty of states that lack most of the above conditions). Development is too complex to fit these ideas 100 percent of the time, of course—there are authoritarian exceptions like Singapore. China is not yet an exception because its income level is still less than one tenth that of the US. We can conjecture that China's rapid change in income has followed positive changes in individual economic (and even some political) rights."

"Perhaps prosperity is not after all designed from above; perhaps it emerges from below, from the independent actions of many individuals who figure out their own paths."

In the end, Korea didn't need experts like Ha-Joon Chang as much it needed entrepreneurs like Ju-Yung Chung. Chung was the son of North Korean peasant farmers, who had to leave school at fourteen to support his family. He had failed at successive jobs as a railway construction laborer, a dockhand, a bookkeeper, and a deliveryman for a rice shop in Seoul. At age twenty-two, he took over the rice shop, but it failed. He started A-Do Service Garage to do auto repair, which also failed. At age thirty-one in 1946 in Seoul, Chung again started an auto service, which finally became his first successful business. That auto service grew and diversified over the years. It is now known as Hyundai."

Sunday, September 20, 2009

Thomas Friedman on Renewable Energy

His Op Ed is here. I quote: "Here is what is indisputable: The world is on track to add another 2.5 billion people by 2050, and many will be aspiring to live American-like, high-energy lifestyles. In such a world, renewable energy — where the variable cost of your fuel, sun or wind, is zero — will be in huge demand.China now understands that. It no longer believes it can pollute its way to prosperity because it would choke to death. That is the most important shift in the world in the last 18 months. China has decided that clean-tech is going to be the next great global industry and is now creating a massive domestic market for solar and wind, which will give it a great export platform"